Matplotlib简单绘图
Matplotlib是一个 Python 库,可帮助可视化和分析数据,并借助可以使用 matplotlib 库进行模拟的图形化可视化帮助更好地理解数据。Matplotlib 是一个用于静态、动画和交互式可视化的综合库。
在本章中,我们将学习如何使用 Matplotlib 创建一个简单的绘图。
推荐:Matplotlib简介
导入Matplotlib Pyplot模块
我们现在将在 Matplotlib 中显示一个简单的弧度角与正弦值的折线图。首先,导入来自 Matplotlib 包的 Pyplot 模块,按照惯例使用别名 plt。
import matplotlib.pyplot as plt接下来我们需要一个数字数组来绘制。使用 np 别名导入的 NumPy 库中定义了各种数组函数。
import numpy as np我们现在使用 NumPy 库中的 arange() 函数获得角度在 0 到 2π 之间的 ndarray 对象。
x = np.arange(0, math.pi*2, 0.05)ndarray 对象用作图形 x 轴上的值。要在 y 轴上显示的 x 中角度的相应正弦值通过以下语句获得 –
y = np.sin(x)使用 plot() 函数绘制来自两个数组的值。
plt.plot(x,y)您可以设置绘图标题以及 x 和 y 轴的标签。
You can set the plot title, and labels for x and y axes.
plt.xlabel("angle")
plt.ylabel("sine")
plt.title('sine wave')
绘图查看器窗口由 show() 函数调用 –
plt.show()完整的程序如下 –
from matplotlib import pyplot as plt
import numpy as np
import math #needed for definition of pi
x = np.arange(0, math.pi*2, 0.05)
y = np.sin(x)
plt.plot(x,y)
plt.xlabel("angle")
plt.ylabel("sine")
plt.title('sine wave')
plt.show()
执行上述代码行时,将显示下图 –
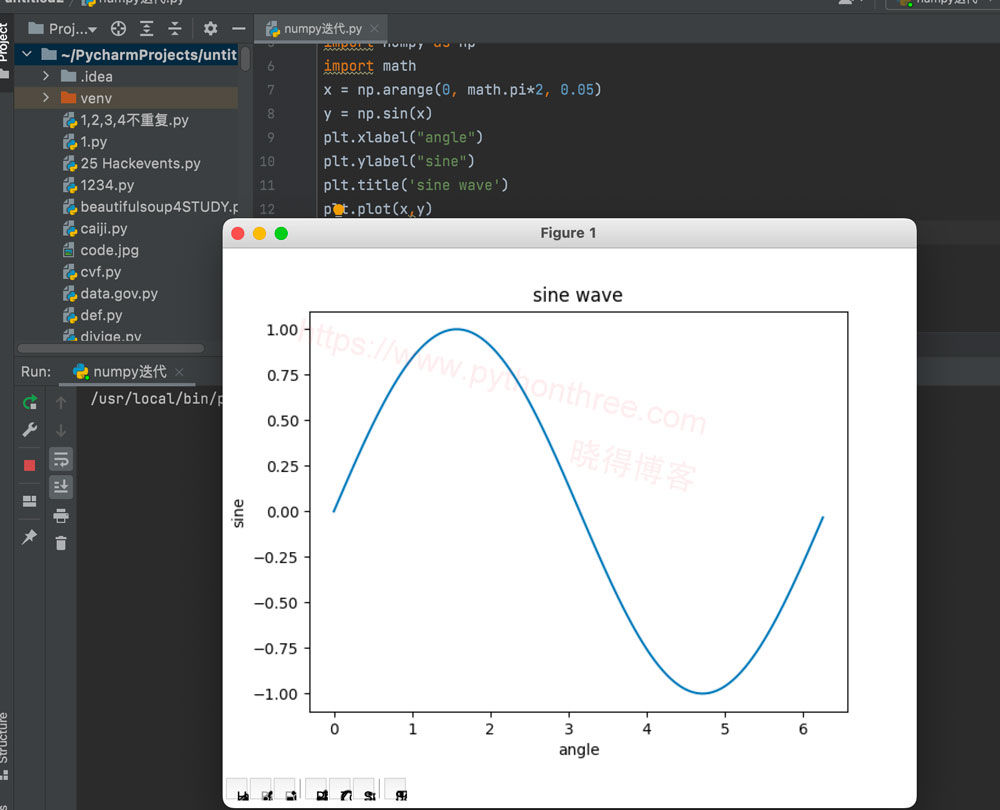
注意:如果出现module ‘backend_interagg’ has no attribute ‘FigureCanvas’错误,可添加代码matplotlib.use(‘TkAgg’)。
Jupyter notebook中使用Matplotlib
现在,将 Jupyter notebook 与 Matplotlib 一起使用。
如前所述,从 Anaconda导航器或命令行启动Jupyter notebook。在输入单元格中,输入 Pyplot 和 NumPy 的导入语句 –
from matplotlib import pyplot as plt
import numpy as np
要在Jupyter notebook(而不是在单独的查看器中)显示绘图输出,请输入以下魔术语句 –
%matplotlib inline获取 x 作为 ndarray 对象,其中包含 0 到 2π 之间的弧度角度,以及 y 作为每个角度的正弦值 –
import math
x = np.arange(0, math.pi*2, 0.05)
y = np.sin(x)
为 x 和 y 轴设置标签以及绘图标题 –
plt.xlabel("angle")
plt.ylabel("sine")
plt.title('sine wave')
最后执行 plot() 函数在笔记本中生成正弦波显示(无需运行 show() 函数)
plt.plot(x,y)总结
以上是晓得博客为你介绍的Matplotlib简单绘图的全部内容,Matplotlib是 Python 语言强大的二维绘图库,能够创建各种图形、绘图、图表、直方图等等。在大多数情况下,matplotlib 会在调用该方法时简单地将图表输出到您的视口.show()。
推荐:Matplotlib教程

