使用PyScript在Web上运行Python可视化
PyScript 是一个开源框架,可让您直接在 Web 浏览器中运行 Python 代码,从而可以使用 Python 为后端和前端创建交互式 Web 应用程序。该框架弥合了 Python 和 JavaScript 之间的差距,使开发人员能够在 Web 环境中利用 Python 的数据分析、机器学习和可视化库的强大功能
利用 Python 对数据分析和可视化的一流支持来美化您的网页。Python 广泛用于数据分析、机器学习、网页抓取等。但您是否知道,您也可以在 HTML 中运行 Python 代码来构建 Web 应用程序?PyScript 使这成为可能,它允许您在浏览器中运行 Python 代码。本文晓得博客为你解释使用PyScript在Web上运行Python可视化借助几个 PyScript-HTML 示例,了解如何将 matplotlib 可视化添加到网页。
推荐:如何用Python下载网页上图像
PyScript 是什么?
PyScript 是一个开源 Web 框架, 可让您在 Web 浏览器中运行 Python。它集成了 HTML 界面以及 Pyodide、WASM 和现代 Web 技术的强大功能。PyScript 目前处于开发阶段,但它已经具有一些令人兴奋的功能。它有可能成为创建强大 Web 应用程序的工具。
该项目使用的代码可在 GitHub 存储库中找到 ,并可在 MIT 许可下免费使用。如果您想查看该项目的实时版本,可以查看 线图 和 条形图 演示。
设置 HTML 样板
在使用 PyScript 之前,您需要进行设置。创建一个新的 HTML 文件并设置 HTML 样板。大多数 现代 IDE 都提供自动创建样板的功能。您只需输入 doc 或 html 并按回车键即可。您也可以使用以下模板开始:
<!DOCTYPE html>
<html>
    <head>
        <meta charset="utf-8">
        <meta http-equiv="X-UA-Compatible" content="IE=edge">
        <title></title>
        <meta name="description" content="">
        <meta name="viewport" content="width=device-width, initial-scale=1">
    </head>
    <body>

    </body>
</html>
将 PyScript 添加到 HTML:“Hello, World!” 使用 PyScript
您可以在 HTML 文件中使用 PyScript,方法是下载它或在 HTML 头中链接其 CDN。在HTML 文件的<head>部分中添加以下内容 :
<link rel="stylesheet" href="https://pyscript.net/alpha/pyscript.css" />
<script defer src="https://pyscript.net/alpha/pyscript.js"></script>
这就是设置 PyScript 所需要做的全部工作。
要验证 PyScript 是否已成功集成,请在<body>部分添加以下代码行 :
<body>
    <py-script>print("Hello, World!")</py-script>
</body>
在任何网络浏览器中打开 HTML 文件,您将看到 上面打印的“Hello, World!” 。
推荐:
加载 Matplotlib 库
您需要使用 <py-env> </py-env> 标签来导入 Python 模块。 使用以下代码片段在 HTML 文件的<head>部分 中 加载matplotlib模块:
<py-env>
        - matplotlib
</py-env>
推荐:如何使用PIP安装Python yaml包
使用 PyScript 在浏览器中显示线图
创建一个 带有 id的<div>。您需要 id来将其与<py-script>标签 的 输出属性 一起使用 。
<div id="matplotlib-lineplot"> </div>
您需要在 <py-script> 标签中编写 Python 代码。将上述 id分配 给 <py-script>标签 的 output属性 。
<py-script output="matplotlib-lineplot">
        # Python Code
 </py-script>
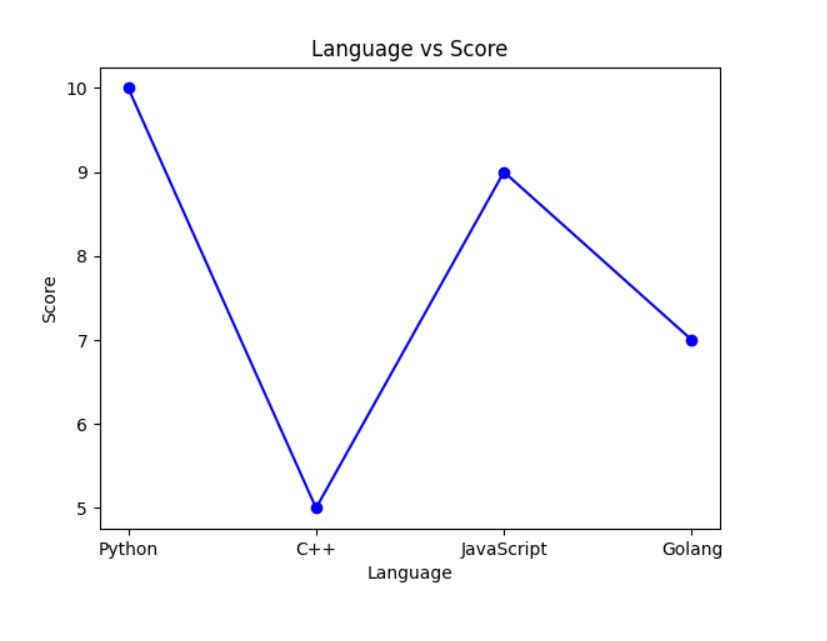
现在您可以编写 Python 代码来创建线图了:
    <body>
        <div id="matplotlib-lineplot"></div>
        <py-script output="matplotlib-lineplot">
            # Python Code

            # importing the matplotlib library
            import matplotlib.pyplot as plt
            fig, ax = plt.subplots()
            # x axis
            x = ["Python", "C++", "JavaScript", "Golang"]
            # y axis
            y = [10, 5, 9, 7]
            plt.plot(x, y, marker='o', linestyle='-', color='b')
            # Naming the x-label
            plt.xlabel('Language')
            # Naming the y-label
            plt.ylabel('Score')
            # Naming the title of the plot
            plt.title('Language vs Score')
            fig
         </py-script>
    </body>
当您在 Web 浏览器中打开 HTML 文件时,您将看到下图所示的内容:
 使用PyScript在Web上运行Python可视化 4
使用PyScript在浏览器中显示条形图
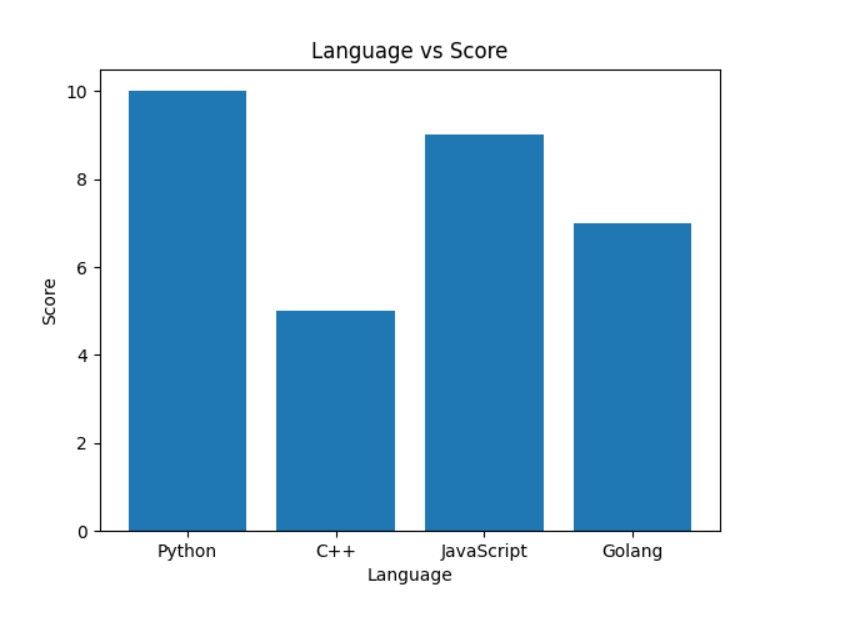
您可以使用以下 Python 代码片段在浏览器中创建条形图:
<body>
    <div id="matplotlib-bar"></div>
    <py-script output="matplotlib-bar">
        # Python Code

        # importing the matplotlib library
        import matplotlib.pyplot as plt
        fig, ax = plt.subplots()
        # x axis
        x = ["Python", "C++", "JavaScript", "Golang"]
        # y axis
        y = [10, 5, 9, 7]
        plt.bar(x, y)
        # Naming the x-label
        plt.xlabel('Language')
        # Naming the y-label
        plt.ylabel('Score')
        # Naming the title of the plot
        plt.title('Language vs Score')
        fig
     </py-script>
</body>
此代码产生以下输出:
 使用PyScript在Web上运行Python可视化 5
 推荐:如何创建空和完整的NumPy数组
总结
以上是晓得博客为你介绍的使用PyScript在Web上运行Python可视化您可以使用 PyScript 和 Python 库(如 Matplotlib、Bokeh、Seaborn 等)在 HTML 中构建功能强大的仪表板和图表。但是,您可能应该暂缓在生产中使用它,因为它正在大力开发中。该软件目前存在多个问题,包括加载时间和可用性。将来,PyScript 可能会打开大门,让 Python 操作在 Web 上更顺畅地运行和执行。
推荐:Max Mega Menu插件教程WordPress添加超级菜单
推荐:Enfold响应式多功能主题功能特色